The Mandelbrot set, as you’re probably aware, is the set of points c in the complex plane such that iterating f(z) = z² + c repeatedly doesn’t escape to infinity. By invoking the triangle inequality, it can be shown that a point escapes to infinity if and only if it ever leaves the disc of radius 2 centred on the origin.
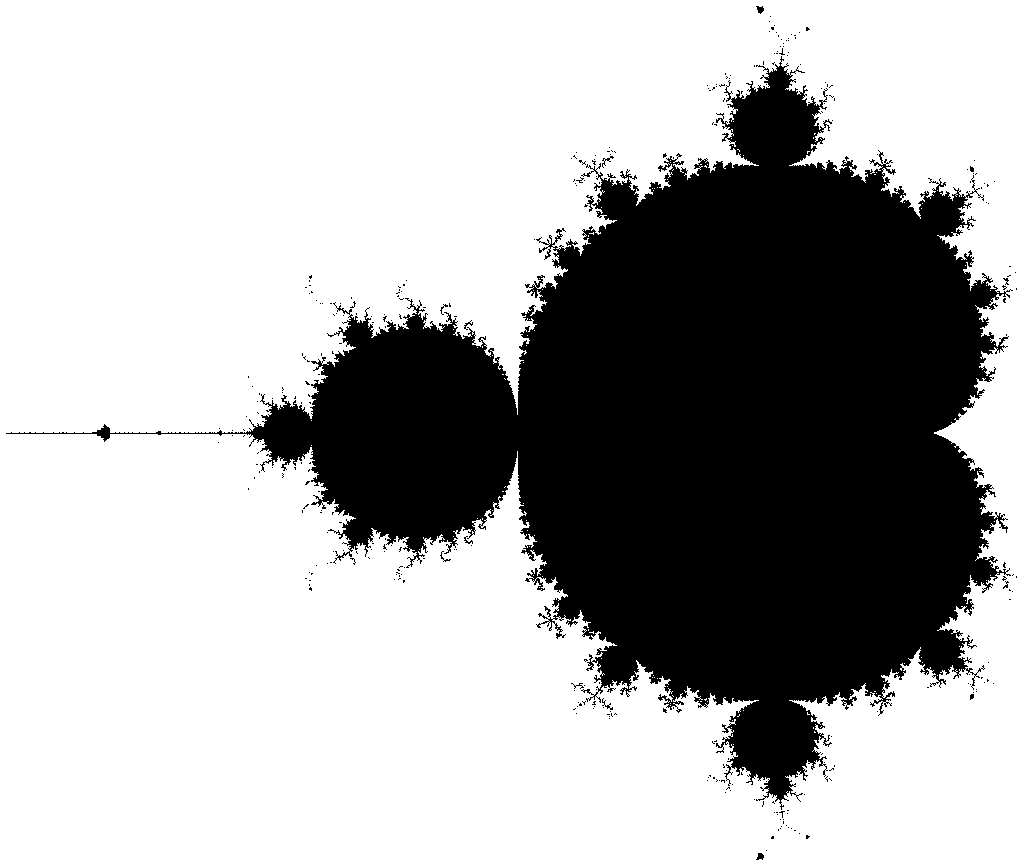
A couple of weeks ago, I generated a 262144 by 262144 monochromatic image of the Mandelbrot set. When viewed an an ordinary monitor, it is comparable to the area of a football pitch. The compressed file (25 megabytes!) can only be opened in the cellular automata program Golly. It is stored as an optimised quadtree, which means that identical regions are stored in the same memory. For a monochromatic image such as this one, the file size is very compact (0.0004 bytes per pixel, on average).
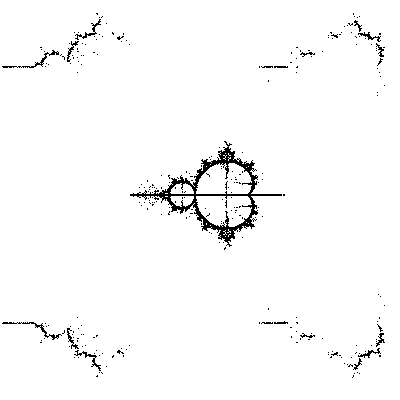
The fun thing is that Golly can run cellular automata rules (as it’s been designed), so we can see what happens when this huge rendering of the Mandelbrot set is iterated in Conway’s Game of Life. It’s rather anticlimatic, really, resulting in four waves of gliders and a few orthogonal spaceships radiating from a Mandelbrot-shaped blob of random faeces.
Coloured images don’t compress very well as mc.gz files. In order to avoid my programs choking on the file, I had to reduce the size of the image to 65536 by 32768 for the full-colour Mandelbrot set. The points are coloured according to the number of iterations required for the point to escape the disc of radius 2. I’ve only rendered half of it due to the symmetry of the set; I chose the positive imaginary part of the complex plane without loss of generality (a great phrase, don’t you think?). When initially loaded into Golly, it looks relatively boring:
Basically, Tom Rokicki has designed his implementation of Gosper’s HashLife algorithm to be as efficient as possible. That means no colour information can be stored, unfortunately (even though I worked out a way of doing it, which only increases the quadtree size by 6-18%). Hence, we need to zoom in to appreciate the true beauty of the Mandelbrot set:
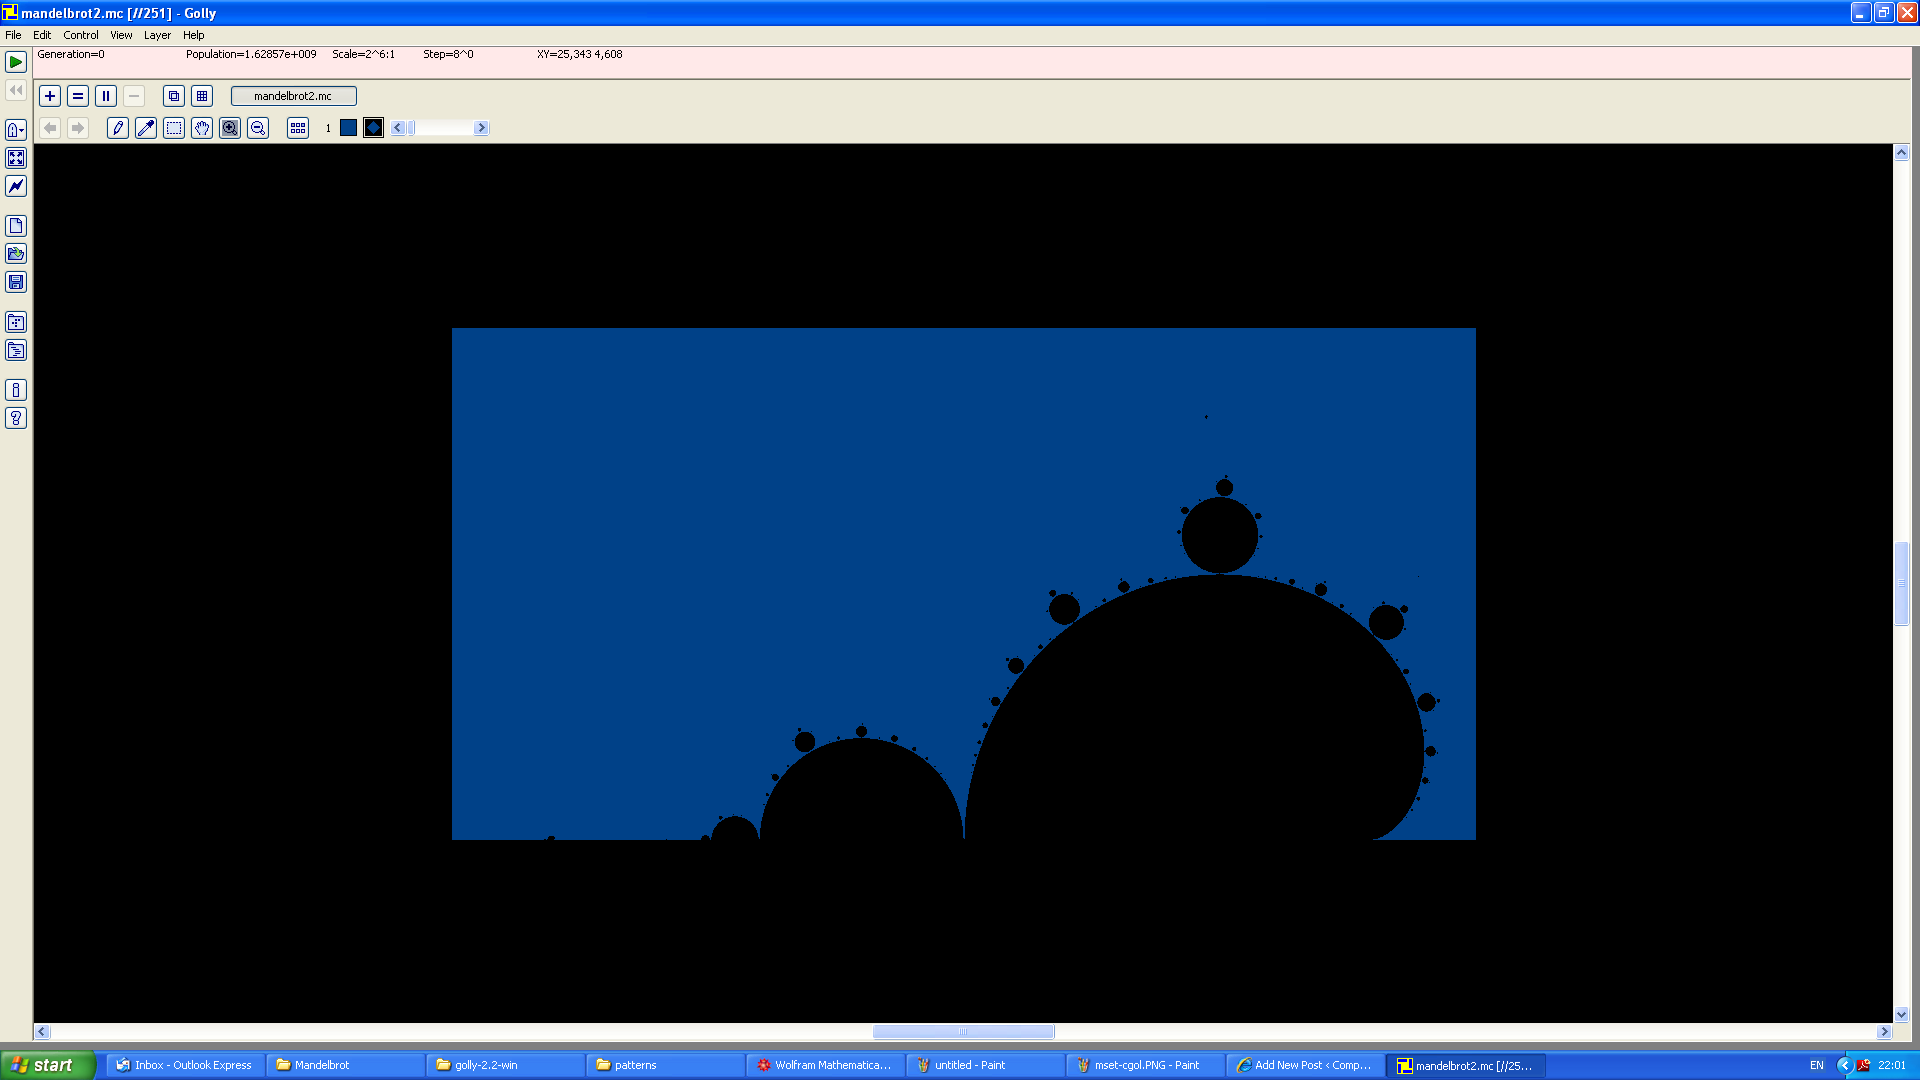
Looking at that, you would presume that this is a special fractal program, rather than a screenshot of Golly. Many details are apparent only in the coloured version, such as the whorls, spirals and dendritic fibres connecting the Mandelbrot set to its offspring. You can download the pattern file (40 megabytes!) and explore it for yourself. It’s certainly more visually attractive than its massive monochromatic cousin. The general favourite place to look is Seahorse Valley, between the cardioid and largest circle of the Mandelbrot set.
Of course, these screenshots don’t compare to downloading the 40 megabyte file and viewing it in Golly yourself! The cellular automata community will probably hate me now for abusing Golly to explore the Mandelbrot set. Please forgive me. Anyway, here’s a third and final Golly screenshot to persuade Tom Rokicki to include coloured subpixel zooms:
Golly gosh!


Pingback: Infinite monkey theorem | Complex Projective 4-Space
As a user of golly for cellular automaton, I find this amazing. There is no problem with using software for something like this. How do you upload fractal patterns into a golly-readable file?
I computed the fractal in Mathematica and exported it as a quadtree (.mc). I then fed it into a C++ program I wrote to optimise the quadtree (compressing it by 50% for the colour version and 90% for the monochrome version).
Thank you for writing thhis